Configuring Traffic Analysis Display for APs

Using traffic analysis you can measure the total volume of traffic sent or received by an Access Point (AP).

You can view historical and real-time data of the AP. Throughput and the number of clients connected to the AP are displayed in a bar chart. You can view the count of AP model details supported on the system in a pie chart. You must configure the AP settings to view its traffic analysis.

To configure the AP settings:

  1. From the Access Points area, click settings . 
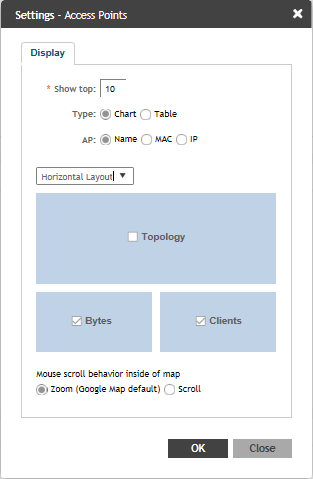
The AP setting form displays.
    Figure 19  AP Settings Form


  2. In the Show top box, enter the number of APs for which the traffic must be analyzed. Range: 5 through 20.
  3. Select the Type radio button for the type of display you want to view. The choices are Chart or Table.
  4. Select the AP identification option to be displayed. The choices are Name, MAC, or IP.
  5. From the drop-down, select the required display layout. The choices are Horizontal Layout or Vertical Layout.
  6. Select or clear the required options that must be displayed in the Content area.
    1. Topology—To view the location map.
    2. Bytes—To view the location map.
    3. Clients—To view the location map.
    4. AP Models—To view the location map.
  7. Select the following mouse-scroll behavior when you point the mouse over a map.
    1. Zoom
    2. Scroll
  8. Click OK.