Viewing Events
Events are triggered by an occurrence or the detection of certain conditions in the switch. For example, when the temperature of the device reaches warning levels, or when the fan speed changes, an event is triggered. You can view these details from the Events tab for individual switches, stacks and switch groups.
The alarms generate for the switch also reflect in the page.
-
Select the switch or group. Then select the
Events tab.
Figure 70 ICX Events Tab
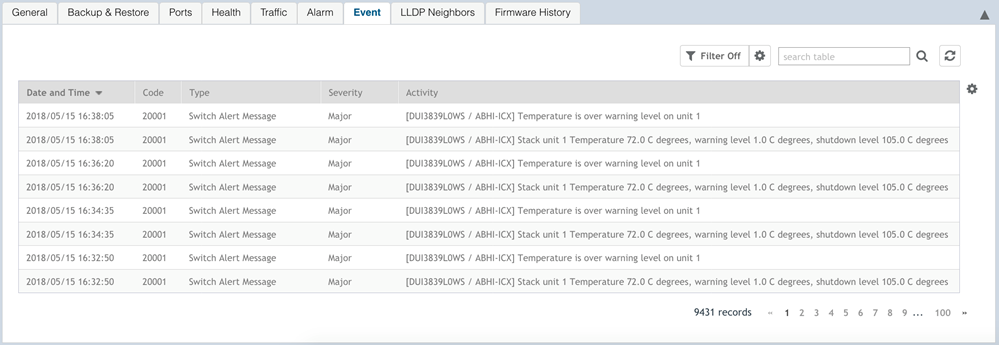 The following information is displayed in the Events tab:
- Date and Time: Displays the date and time when the event occurred
- Code: Displays the event code (see the Alarm and Event Reference Guide for your controller platform more information)
- Type: Displays the type of event that occurred (for example, Switch configuration updated)
- Severity: Displays the severity level assigned to the events such as Critical, Debug, Informational, Warning, Major etc .
- Activity: Displays additional details about the event
Click
 to export the events details to a CSV file. Check the default download folder of your web browser and look for a file named
events.csv and view it using a spreadsheet application
to export the events details to a CSV file. Check the default download folder of your web browser and look for a file named
events.csv and view it using a spreadsheet application
You can also view alarms by their severity, date and time. Click
 to apply filters.