Viewing Switches on the Dashboard
The wired dashboard displays detailed information about the health of the switch and graphs indicating traffic trends.
-
Click
Wired.
The
Wired page is displayed as shown in the following example.
Figure 1 Wired Devices
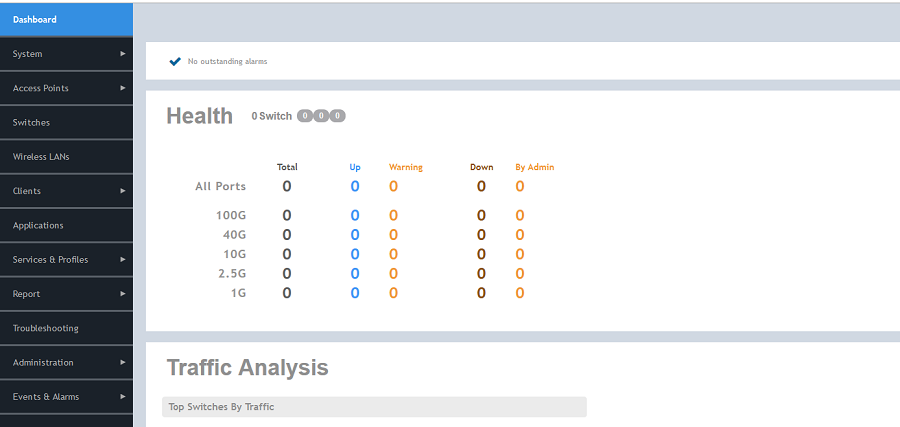
The Health section displays the number of switches that are online, offline, and flagged. It also displays the number of ports by speed and indicates whether they are Up, Warning, Down, or Down By Admin.
The Traffic Analysis section displays the following information:- Top switches based on traffic
- Top ports based on traffic
- Top switches based on port errors
- Top switches based on PoE utilization