Viewing Traffic Trends in the Switch
You can view statistical information about how traffic is handled at the switch level. These details are available for individual switches, stacks and switch groups.
-
Select the switch or group. Then select the
Traffic tab.
Figure 72 Traffic Trend for a Switch Group
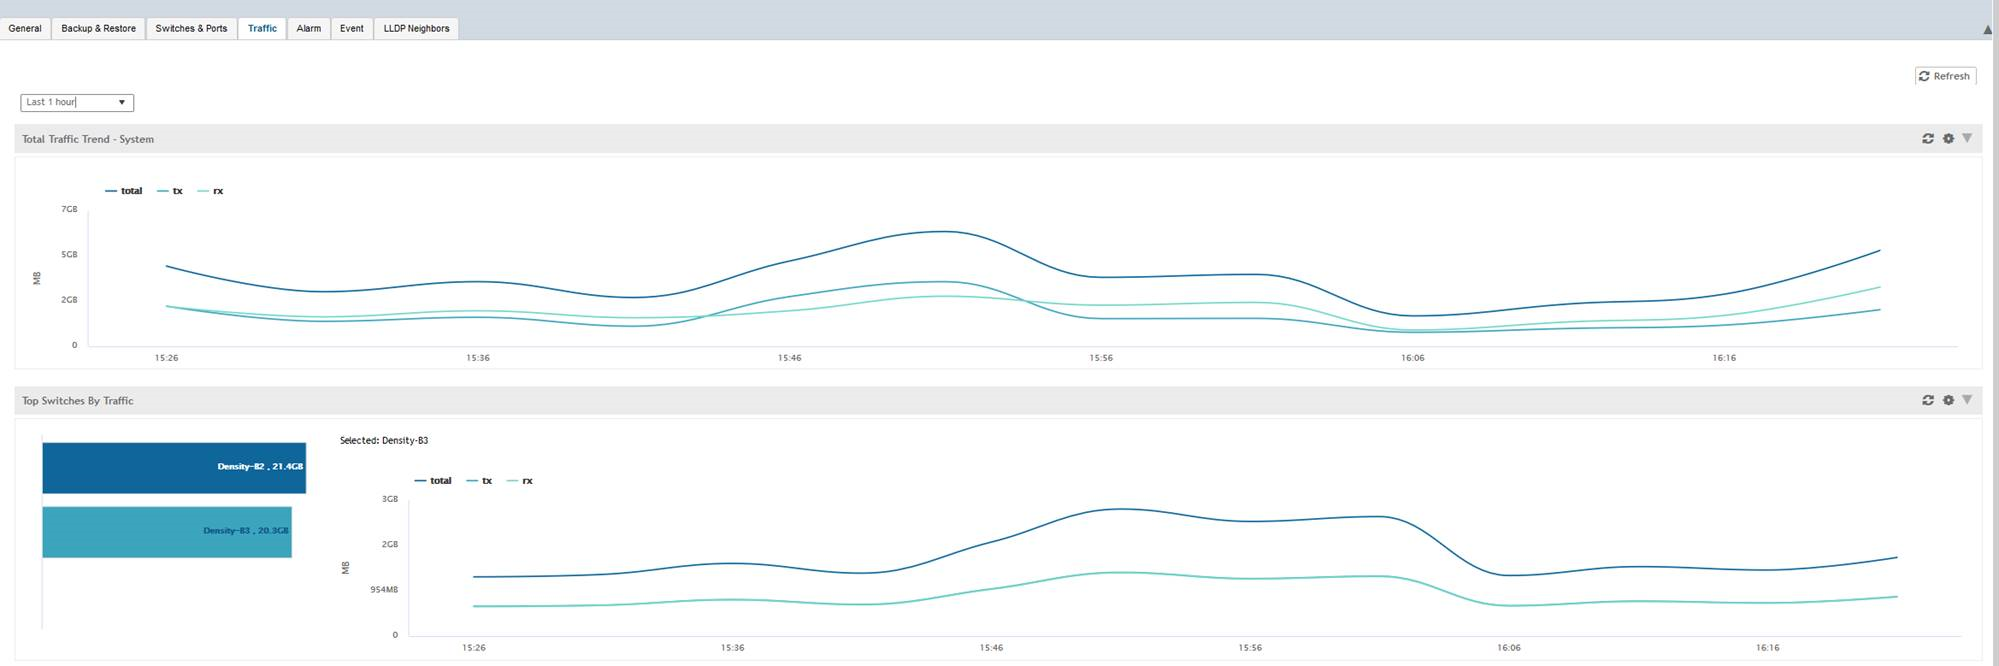 Figure 73 Traffic Trend for a Switch
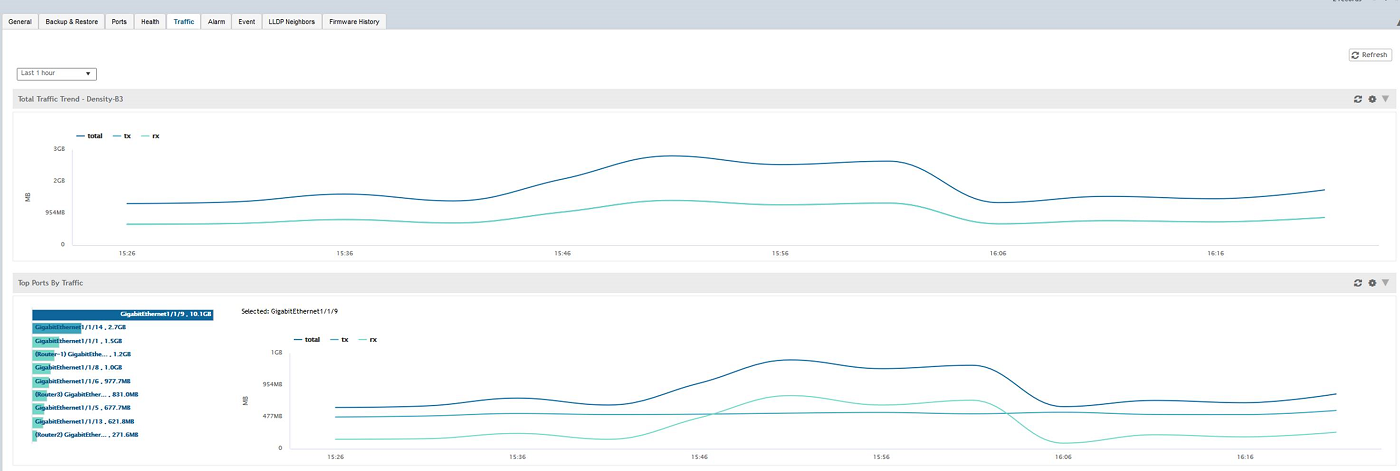 The following information is displayed in the Traffic tab. You can view the traffic trend for the last 1 hour or 24 hours:
- Total Traffic Trend: provides a graphical representation of the network traffic usage over a period of time in the switch or switch group. It also indicates the amount of traffic or data transmitted (tx) and received (rx) by the group in MB, at a certain time and date.
- Top Switch by Traffic: provides a graphical representation of the top switches that handled maximum network traffic over a period of time, in the switch group. You can click on the switch address to view the traffic trend. This trend is only available for switch groups.
- Top Ports by Traffic: provides a graphical representation of the top ports that handled maximum network traffic over a period of time, for a switch. You can click on the port address to view the traffic trend. This trend is only available for individual switches.