Creating Custom Events for ICX Switches
You can create custom events by specifying that a particular switch status, for example a particular CPU utilization, memory utilization, or text pattern, generates an alarm or an event. Therefore, there are 3 types of custom events - CPU, Memory and TextPattern.
Because the polling interval between the switch and the controller is 5 minutes, the switch status cannot be obtained in real time. However, you can monitor memory and CPU utilization by creating an event or alarm that is triggered when a particular threshold is reached. You can also create a custom event to monitor for switch events based on text patterns.
To create a customer event, perform the following steps.
NOTE
DB Persistence must be enabled to generate custom events.
-
Click the
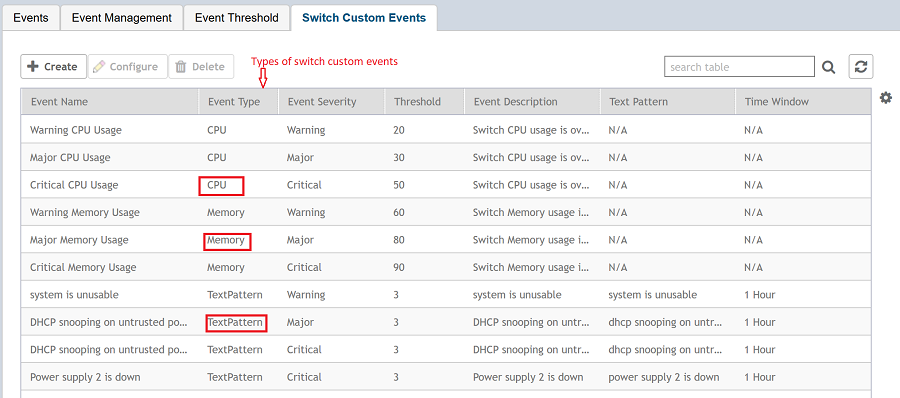
Switch Custom Events tab.
The Switch Custom Events page is displayed.Figure 209 Types of custom events available
-
Click
Create.
The Create Switch Custom Events page is displayed as shown in the following example.NOTEYou can only create new TextPattern custom events. Custom events of CPU or Memory type can only be edited or configured, and cannot be created.Configure the following:Figure 210 Creating custom events for switches - TextPattern type
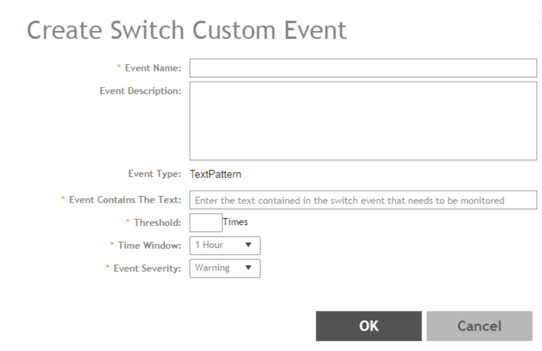
- Event Name: Enter the name of the event. For example, you can provide a name to identify the text pattern to be displayed in the event description.
- Event Description: Enter a detailed description of the event.
- Event Type: Displays the type of event. Here, Text Pattern.
- Event Contains The Text: Enter the text used in the event to be monitored.
- Threshold: Enter the number of times the user-defined status is achieved.
- Time Window: Select the time frame within which the threshold is achieved. You can select from a few hours to two days.
- Event Severity: Select the severity level of the custom event. Options include Warning, Major, and Critical.
Configure the following:Figure 211 Editing custom events for switches - CPU/Memory type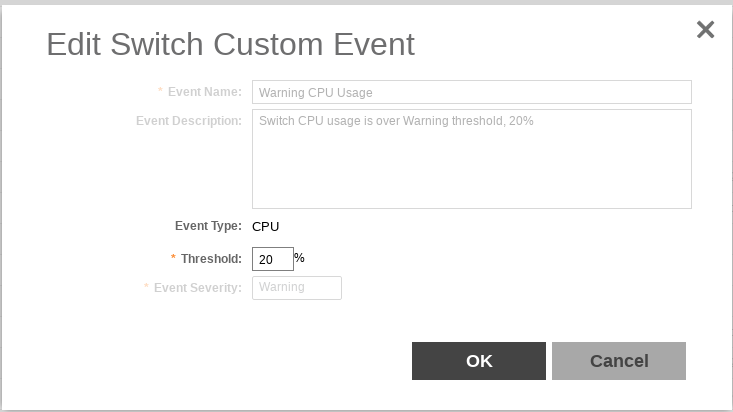
- Event Name: Displays the name of the event.
- Event Description: Displays a detailed description of the event.
- Event Type: Displays te type of event. Here, CPU.
- Threshold: Enter the percentage of times the user-defined status is achieved.
- Event Severity: Displays the severity level of the custom event. Options include Warning, Major, and Critical.