Viewing Alarms
Syslog messages from the switch are sent to the controller to periodically communicate switch health and status. It also brings your attention to issues that may need resolution at the switch level. You can view these details from the Alarms tab for individual switches, stacks and switch groups.
- Power Supply failure
- Fan failure
- Module Insertion or removal
- Temperature above the threshold warning
- Stack member unit failure
- PoE power allocation failure
- DHCP offer dropped message
- Port put into error disable state
The alarms generate for the switch also reflect in the page.
-
Select the switch or group. Then select the
Alarms tab.
Figure 58 ICX Alarms Tab
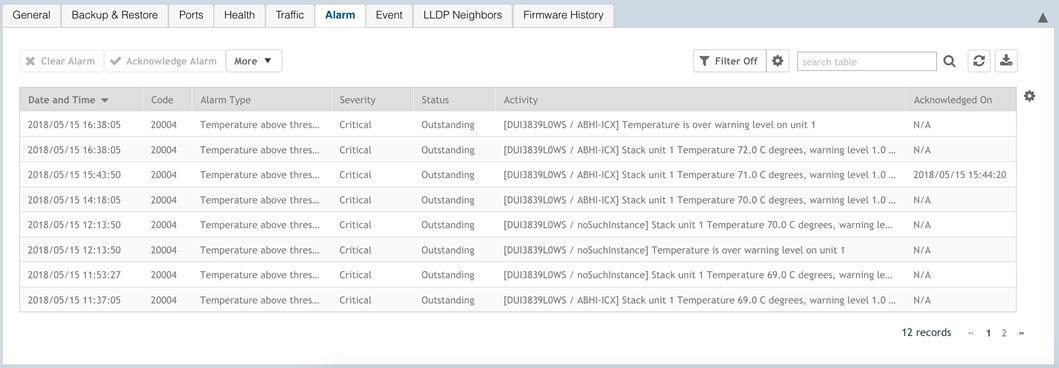 The following information is displayed in the Alarms tab:
- Date and Time: Displays the date and time when the alarm was triggered
- Code: Displays the alarm code (see the Alarm and Reference Guide for your controller platform for more information).
- Alarm Type: Displays the type of alarm event that occurred (for example, switch reset to factory settings).
- Severity: Displays the severity level assigned to the events such as Critical, Major, Minor and Warning.
- Status: Indicates whether the alarm has already been cleared or still outstanding.
- Activity: Displays additional details about the alarm, such as how long was the switch offline for
- Acknowledged On: Displays the date and time when the administrator acknowledge the alarm
- Cleared By: Displays information about who cleared the alarm
- Cleared On: Displays the date and time when the alarm was cleared
- Comments: Displays administrator notes recorded during alarm management
Click
 to export the alarms details to a CSV file. Check the default download folder of your web browser and look for a file named
alarms.csv and view it using a spreadsheet application
to export the alarms details to a CSV file. Check the default download folder of your web browser and look for a file named
alarms.csv and view it using a spreadsheet application
Clearing an alarm removes the alarm from the list but keeps it on the controller's database. Select the alarm from the list and click Clear Alarm. The Clear Alarm page appears. Type your comments and select Apply.
Acknowledging an alarm lets other administrators know that you have examined the alarm. Click Acknowledge Alarm to acknowledge an alarm. After you acknowledge an alarm, it will remain on the list of alarms and will show the date and time that you acknowledged it.
You can also view alarms by their severity, status, date and time stamp. Click
 to apply filters.