Viewing Switch Health
You can view information about the health of a switch based on its memory usage and CPU usage statistics. For a stack, it displays the information for the active (master) switch of the stack.
-
From the drop-down menu, select the duration for which you want to view the switch health.
The following information is displayed based on the duration selected:
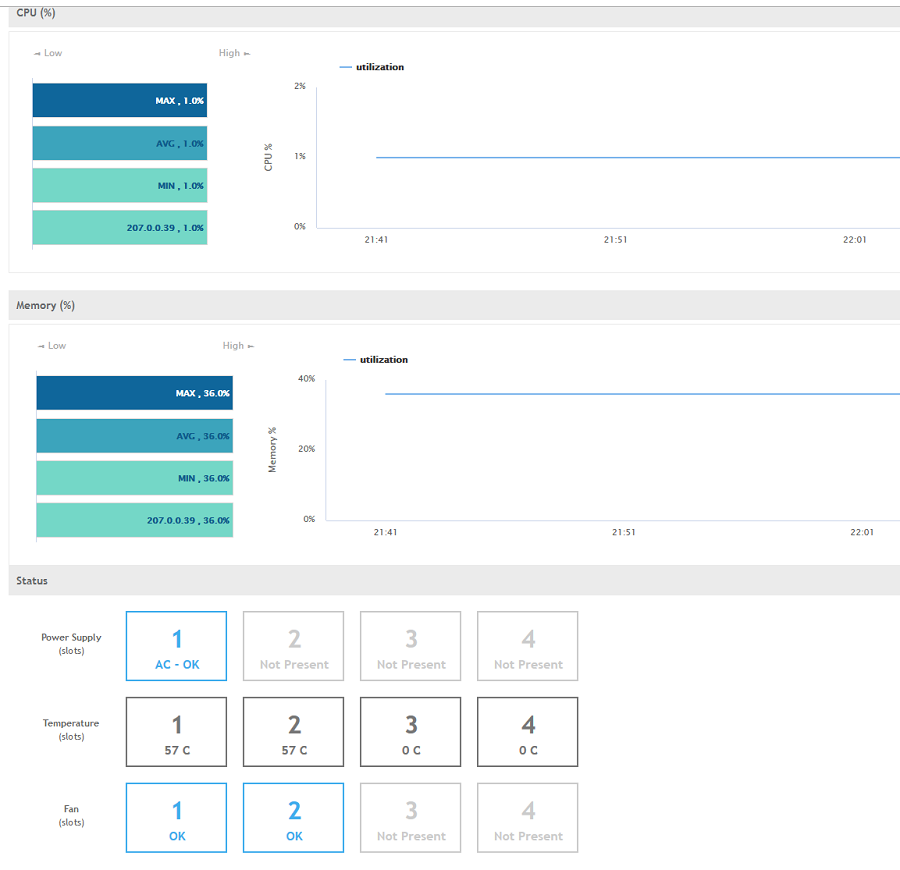
- CPU (%): displays the CPU usage of the switch for the duration selected. It also indicates the minimum, maximum, average and current CPU usage trends of the switch.
- Memory (%): displays the memory usage of the switch for the duration selected. It also indicates the minimum, maximum, average and current memory usage trends of the switch.
- Status: displays the status of the power supply, temperature and fan slots for each of the four switch modules.
You can click
 to modify the display settings. You can view the trend as a
graph or a
table. You can also modify the display to reflect the switch
name,
MAC address or IP address.
Figure 57 Health Tab
to modify the display settings. You can view the trend as a
graph or a
table. You can also modify the display to reflect the switch
name,
MAC address or IP address.
Figure 57 Health Tab