Viewing AP Performance
Click the Performance tab to analyze the following parameters:
- Latency - Average time delay between an AP and connected clients.
- Airtime Utilization - Percent of airtime utilized, by radio.
Clicking
Airtime Detail displays a pie chart that depicts a detailed breakup of the reception and transmission percentages (Rx and Tx) against parameters such as Data, Management, Unicast, Multicast, Interference and Network Load. Following are the statistics that are evaluated:
Table 3 Airtime Utilization Statistics Total Total Airtime under observation RxLoad Airtime spent in receiving frames destined to AP in Micro seconds RxInt Airtime spent in receiving frames NOT destined to AP in Micro seconds TxSuccess Airtime spent in transmitting frames successfully in Micro seconds TxFailed Airtime spent in transmit failed in Micro seconds NonWifi Airtime where CCA is busy in Micro seconds RxTotal Same as RxLoad or sum of Rx (Mgmt Unicast + Mgmt Bcast + Data Unicast + Data Bcast) RxMgmtU Airtime spent in receiving Management Unicast frames in Micro seconds RxMgmtB Airtime spent in receiving Management Broadcast frames in Micro seconds RxDataU Airtime spent in receiving Data Unicast frames in Micro seconds RxDataB Airtime spent in receiving Data Broadcast frames in Micro seconds TxTotal Same as TxSuccess or sum of Tx (Mgmt Unicast + Mgmt Bcast + Data Unicast + Data Bcast) TxMgmtU Airtime spent in transmitting Management Unicast frames in Micro seconds TxMgmtB Airtime spent in transmitting Management Broadcast frames in Micro seconds Figure 15 Sample Airtime Utilization Pie Chart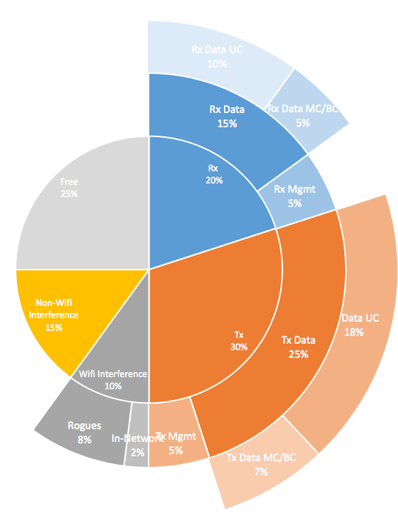
- Capacity - Measurement of potential data throughput based on the recent air-time efficiency and the performance potential of the AP and its currently connected clients.
You can view the parameters based on specific:
- Duration: 1 hour, 24 hours, 7 days, and 14 days
- Radio: 2.4 GHz, 5GHz
The parameters are displayed as Graphs and Bar Charts. When you hover over the graph you can view the Date and Time, Median, Likely Range, Min-Max Range of the parameters. To view specific information on the graph, click and drag the portion. The selected portion would zoom in. To restore to normal view, click the Reset zoom button.
To display specific information, click the settings button. The Settings - Performance window pops up. In Show top, enter the number of APs to be analysed and choose the AP identity display.