Health and Maps
The Health dashboard gives you a very high-level overview of cluster, AP and client information. It also displays a world map view using Google Maps, which provides a global view of your SmartZone-controlled wireless network deployments.
The status bar at the top of the Health dashboard contains an iconic representation of the total Cluster, AP and Client counts for the entire system. This information can be filtered to display a single zone, AP group, or venue using the drop-down filter menu. You can also customize the dashboard layout and threshold settings using the Settings (gear) icon.
For more information on customizing the information displayed on the Health dashboard, see
Customizing Health Status Thresholds.
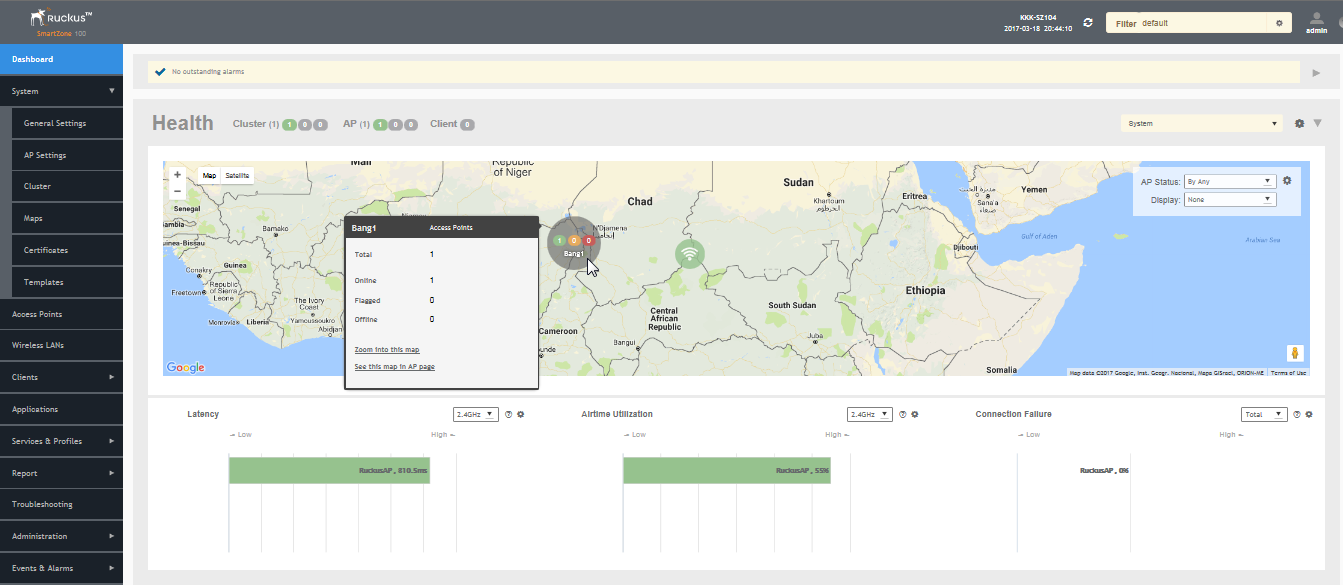
Figure 6
Health Workspace area